Cost of Sales Analysis
![]()
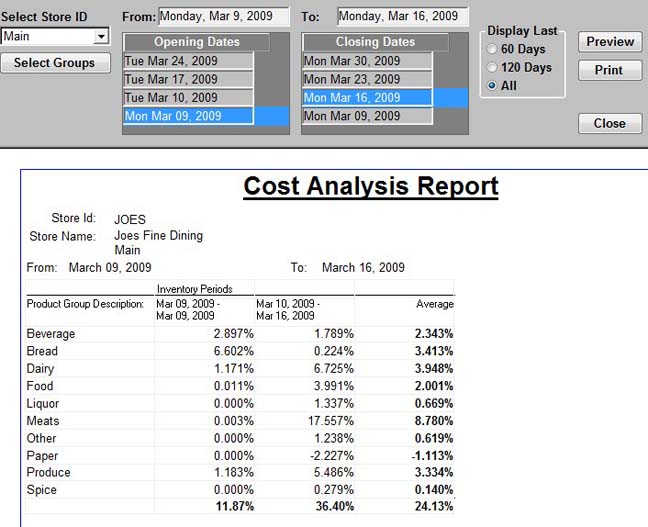
This report will analyze Actual Usage data over up to 4 inventory cycles. It will compare the cost of sales by group and give percentage trending.
To Run the Cost Analysis Report
-
From the Upper Menu choose Reports | Cost of Sales Analysis Report. The report specification window will appear.
-
Select the Store ID (Available only with Multi Store).
-
Select Groups – You can click on his button to add or remove inventory groups from the report.
-
Choose an Opening Date and Closing Date that are up to 4 cycles apart. Default view is for 60 days.
-
Click Preview.