Usage Summary Report
![]()
The most powerful report in the system. This report will show you Actual vs. Ideal usage on every item in your inventory and display variances.
To Run the Usage Summary Report
-
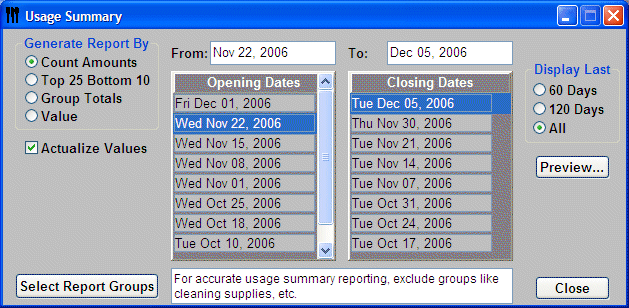
From the Upper Menu, click Reports | Usage Summary.
-
Choose Generate Report By
Amount – Displays all inventory items listed by Group. This report will detail variances based on inventory units and approximate value.
Top 25 bottom 10 – Details the top 25 Most Overused and the 10 Most Underused items all in one sheet. If you can take care of the items on this sheet you will be in good shape. NOTE: There are no drill downs or filtering available in this mode.
Group totals – Displays totals and variances for each group, by value.
Value – Displays all inventory items by value. -
Actualize Values – By default, this option is checked. Any Items that you chose to Actualize when you entered them will be listed as Actual Usage = Ideal Usage. All Actualized items will be shown with a (*) next to ideal amounts. Items such as straws, sugar packets, ketchup bottles etc.
E.G. Sugar packets from the recipe indicate an Ideal Usage of 2.6 cases. Your Actual Usage, was 3.5 cases, this will show a variance of almost a case. If you choose to run Actualized and Sugar packets has been chosen as an Actualized item then the Actual Usage and the Ideal Usage will match…no variance. -
Select Report Groups – Select the groups or groups that you wish to view for the report.
-
Choose the Opening and Closing Dates.
-
Click Preview.
.jpg)
Additional Information
-
Actual Usage Calculations – Opening Inventory + Purchases less Closing inventory = Actual usage.
-
Ideal Usage Calculations – From Sales Mix calculations based on recipes (double click to drill down into the recipes that the item is listed in).
-
Sort Report – You can select a Sort by from the list at the top of the window or you can click on any of the headers to sort by that information.